Lua is a great programming language and I use it as embedded scripting language in
What impresses me most it's flexibility. What ever I come up with is only a few lines away ... and I have crazy ideas. Like profiling lua scripts with KCacheGrind.
For profiling lua-scripts you can use
- luaprofiler
- pepperfish profiler
- or build your own with
debug.sethook()
From my development in C I'm a big fan valgrind which has a plugins for
- memcheck: memleaks
- cachegrind: cache usage
- massif: memory allocation patterns and
- callgrind: calltrees and profiling with KCacheGrind
After taking the callgrind file-spec and playing with debug.sethook() and debug.getinfo() I can now generate useful performance graphs for lua scripts.
Download
Usage
To use the lua-callgrind you only have to use it as a call-wrapper around your script that you want to test:
$ lua lua-callgrind.lua <lua-script> [output file]
If outputfile isn't specified the output is written to lua-callgrind.txt.
$ kcachegrind lua-callgrind.txt
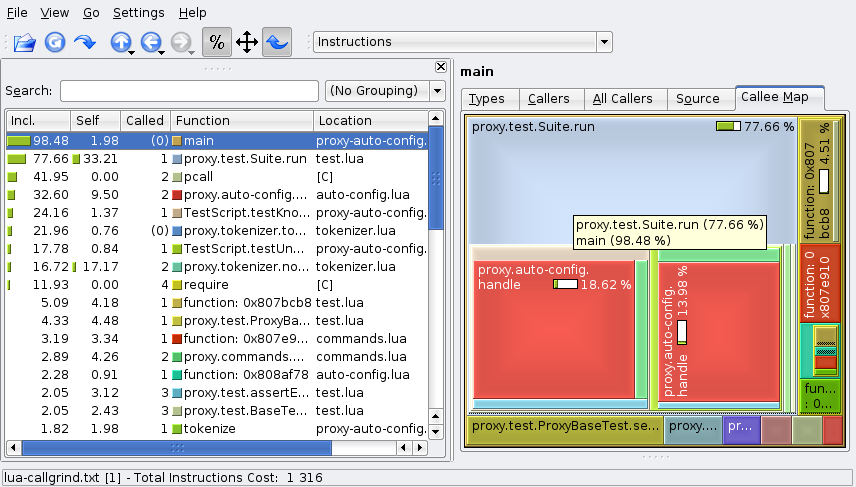
Now you can get the calltrees, the callmap (as show) and dive through the source-code with annotated costs.
Implementation Details
I had to jump through some hoops to get to this stage.
Costs
What you see in the profiling data is the instruction code of the lua-vm. C-functions appear as no cost for now. In the future I may add "os.clocks()" to get CPU-time into the math and that way at least move the C-functions into the picture.
Tracking the stack
The first version could run very well for simple scripts but failed for my unit-test framework. It makes use of pcall() and error(). Assuming that each call event is mirrored with a return event led to a funny looking graph as the cost got assigned to the wrong functions.
i = 0
function f()
        i = i + 1

        if i > 4 then error("out") end
        f()
end

pcall(f)
The stack tracking helped to see where we went wrong. Some assert()ions later the issue was fixed.
>>function: 0x8071960 (main)
 >>function: 0x806b108 (pcall)
  >>function: 0x806df98 (nil)
   >>function: 0x806df98 (f)
    >>function: 0x806df98 (f)
     >>function: 0x806df98 (f)
      >>function: 0x806df98 (f)
       >>function: 0x806b028 (error)
 <<function: 0x806b108 function: 0x806b108 =? true
Just to open the path to the second issue: runtime errors in a pcall():
pcall(function() asd() end)
Refactoring the code and we are safe again:
>>function: 0x8071960 (main)
 >>function: 0x806b108 (pcall)
  >>function: 0x8075ee8 (nil)
 <<function: 0x806b108 function: 0x806b108 =? true
<<function: 0x8071960 function: 0x8071960 =? true
>>function: 0x806ed38 (sethook)
Resolving function names
In the screen-shot you see the nice functions names like proxy.test.Suite.run. To get this names we have to do our own reserve-mapping for function-addresses (tostring(func)) into method names as the debug.*-API only provides the name of the function, which is run. We have to traverse the global symbol-table and build the "path-name" to the function to get this nice name.
If we can't do it (like for local functions in other files) we use filename we see at call-time (like the boom which is local to test.lua).
In case we can't resolve it at all be cause a closure is called we just use the function 0x.... name we always get.
Comments