Over the last weeks I wrote a mysql-proxy which changes the way you operate with the MySQL Server.

A proxy can operate as Man in the Middle and pass through to network packets to the MySQL Server, but it also change the packets when needed. This opens the several possibilities like a
- pseudo server done
- injection proxy done
- load-balancing proxy done
- connection pool
- XA Transaction Manager
- replication client
- replication filter
- replication off-loader
Some of them are already implemented, some are only ideas for the future.
- http://forge.mysql.com/wiki/MySQL_Proxy has the source and the binaries
- http://forums.mysql.com/list.php?146 is the open forum on the proxy
Admin Server
The admin-server is the most basic implementation of the MySQL server protocol and can respond to some basic queries. It implements:
- socket handling
- the life-cycle of a connection
- mysql wire-protocol
- len-encoding of some fields
- field-types
- result-sets
While the design is based on the ideas from lighttpd in the way that it is using non-blocking network-io the network-protocol is based on the information available in the internals document from dev.mysql.com
The admin-servers implements 2 basic queries which are issued by the mysql command-line client:
select @@version_comment LIMIT 1;
select USER();
Using the admin server you can implement the functionality in a way that every mysql client (php, jdbc, odbc, perl, ...) can execute them.
We use it to export the current config and to track the open connections:
> select * from proxy_connections;
+------+--------+-------+-------+
| id   | type   | state | db    |
+------+--------+-------+-------+
|    2 | proxy  | 8     | world |
|    3 | server | 8     |       |
+------+--------+-------+-------+
and the config:
> select * from proxy_config;
+---------------------------------+----------------+
| option                          | value          |
+---------------------------------+----------------+
| admin.address                   | :4041          |
| proxy.address                   | :4040          |
| proxy.backend_addresses[0]      | 127.0.0.1:3306 |
| proxy.backend_addresses[1]      | 127.0.0.1:3307 |
| proxy.fix_bug_25371             | 0              |
| repclient.master_address        |                |
+---------------------------------+----------------+
Transparent Proxy
Based on the simple admin server a transparent proxy was implemented:
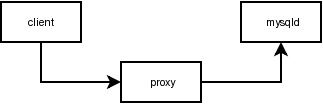
It allows a a whole range of new applications:
- load balancer
- fail-over
- query injection (see Detecting slow Queries below)
- query rewriting
- on the fly bug-fixing #25371
The implementation was tested with:
- the test-suite of ext/mysqlnd (using PHP5)
- the test-suite of Connector/J
As the proxy sits in the connection between app and server it can:
- check the query-time with milli-second resolution
- check status counters
- check the SHOW PROFILE
- check for used indexes
If the user wants to ask for
SELECT user FROM mysql.user;
we enhance the query a bit:
SHOW SESSION STATUS;
SELECT user FROM mysql.user;
SHOW SESSION STATUS;
and only send the result-set for the SELECT back to the user. The diff'ed STATUS counters are written to a log-file:
$ mysql --port=4040 --hostname=127.0.0.1 --user=...
$ mysql-proxy --proxy-lua-script=balance.lua --proxy-profiling

{ "command" : "Query", "timestamp" : "2007-05-22T07:39:00.141568", "query" : "SELECT MAX(population), continent   FROM Country  GROUP BY continent", "thread_id" : "378069", "exec_time" : "33.266", "tags" : [ "query-cost" ], "status" : { "Table_locks_immediate" : "1", "Bytes_received" : "111", "Com_select" : "1", "Key_reads" : "4", "Handler_read_first" : "1", "Last_query_cost" : "17.199000", "Questions" : "1", "Select_range" : "1", "Key_read_requests" : "32", "Bytes_sent" : "283", "Handler_read_key" : "14", "Key_blocks_unused" : "-4" } }
EXPLAIN for index usage statistics
But we can use EXPLAIN for something else ... Index Usage.
Up to now the MySQL doesn't expose any statistics on the index usage. Knowing which indexes are used gives an idea which indexes are maintained, but never user. Dropping them would increase the INSERT/UPDATE/DELETE speed.
root@localhost [world]> EXPLAIN SELECT * FROM City WHERE id = 1;
+----+-------------+-------+-------+---------------+---------+---------+-------+------+-------+
| id | select_type | table | type  | possible_keys | key     | key_len | ref   | rows | Extra |
+----+-------------+-------+-------+---------------+---------+---------+-------+------+-------+
|  1 | SIMPLE      | City  | const | PRIMARY       | PRIMARY | 4       | const |    1 |       |
+----+-------------+-------+-------+---------------+---------+---------+-------+------+-------+
The key column tells us the used index. By maintaining a list of used index and mapping it against the available indexes you can see which of them is used most how often.
root@127.0.0.1 [(none)]> select * from index_usage;
+-------------------------+------+------------------+------------------+
| name                    | used | max_used_key_len | avg_used_key_len |
+-------------------------+------+------------------+------------------+
| world.Country.PRIMARY   |    1 |                3 |           3.0000 |
| world.City.PRIMARY      |    1 |                4 |           4.0000 |
| world.Country.Continent |    1 |                1 |           1.0000 |
+-------------------------+------+------------------+------------------+
Or to show a real application using indexes:
root@127.0.0.1 [(none)]> select * from index_usage;
+------------------------------------------------------------------+------+------------------+------------------+
| name                                                             | used | max_used_key_len | avg_used_key_len |
+------------------------------------------------------------------+------+------------------+------------------+
| world.Country.PRIMARY                                            |    1 |                3 |           3.0000 |
| merlin.inv_agents.PRIMARY                                        |   16 |                4 |           4.0000 |
| merlin.monitor_history_times.adh_scan_time                       |    2 |                8 |           8.0000 |
| merlin.dc_schedule.dc_schedule_fk1                               |   14 |                4 |           4.0000 |
| merlin.monitors.PRIMARY                                          |    8 |                4 |           4.0000 |
| merlin.monitor_history.PRIMARY                                   |    6 |                4 |           4.0000 |
| world.City.PRIMARY                                               |    1 |                4 |           4.0000 |
| merlin.graph_variables.graph_variables_fk1                       |   45 |                4 |           4.0000 |
| merlin.graph_designs.graph_designs_idx                           |    7 |              767 |         767.0000 |
| merlin.monitor_history_times_variables.history_id_alarm_time_idx |   26 |                8 |           8.0000 |
| merlin.monitor_alarm_level.PRIMARY                               |    4 |                4 |           4.0000 |
| merlin.monitor_schedule.PRIMARY                                  |    2 |                4 |           4.0000 |
| merlin.monitor_history.monitor_history_idx                       |    4 |                9 |           9.0000 |
| world.Country.Continent                                          |    1 |                1 |           1.0000 |
| merlin.inv_servers.PRIMARY                                       |   18 |                4 |           4.0000 |
| merlin.monitor_category.PRIMARY                                  |    2 |                4 |           4.0000 |
| merlin.monitor_history.monitor_history_monitor_history_fk1       |   12 |                4 |           4.0000 |
| merlin.dc_schedule.dc_schedule_fk1,dc_schedule_fk3               |    6 |                4 |           4.0000 |
| merlin.monitor_history_times.PRIMARY                             |   18 |                4 |           4.0000 |
| merlin.dc_items.PRIMARY                                          |   14 |                4 |           4.0000 |
| merlin.inv_servers.server_name                                   |    2 |              386 |         386.0000 |
| merlin.graph_series.graph_series_fk                              |   31 |                4 |           4.0000 |
| merlin.monitor_schedule.monitor_schedule_idx                     |   15 |                8 |           8.0000 |
+------------------------------------------------------------------+------+------------------+------------------+
For UPDATE and DELETE statements you can usually rewrite them into SELECT statements to make them EXPLAINable.
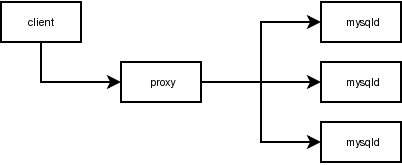
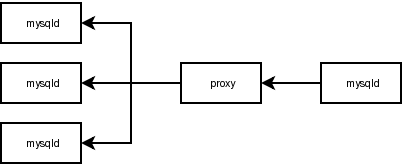
Load Balancing
Load Balancing selects one backend out of a set of backends to be used as mysql-server. We use SQF (shortest queue first) to distribute the load across the backends equally. Each backend will get the same number of connections.
$ ./mysql-proxy  \
  --proxy-backend-addresses=127.0.0.1:3306 \
  --proxy-backend-addresses=127.0.0.2:3306 \
  --proxy-backend-addresses=127.0.0.3:3306
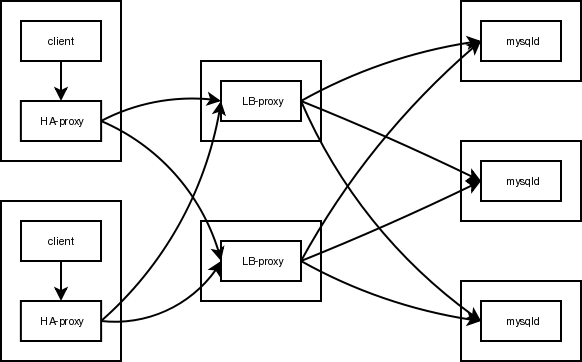
Fail Over
Load Balancing and Fail Over are very similar. Both have to detect of a host is reachable and both have to forward connections to one of the backends. Using a different node-selection strategy you get Fail-Over:
- pick the first available host from a list
As long as the first host is up, it will be used for all queries.
You can put the HA proxy next to the application and let it forward the requests to the real load balancers:
Latency
If you want to put a application like the proxy in the middle of your application you want sure that:
- it is stable
- it adds as little latency as possible
To measure the latency a small C-API based app was written which is testing:
- prepared statements
- plain SELECTs
- large Queries
via the proxy and directly against the database. To get comparable results we used simple queries for the latency checks and verified them against larger queries. The expected latency should be nearly constant if possible:
    /* warmup run */
    test_server("127.0.0.1", 3306);

    /* real benchmarks */
    for (rounds = 0; rounds < 3; rounds++) {
      test_server("127.0.0.1", 3306);
      test_server("127.0.0.1", 4040);
    }
and each test run wrote a INSERT statement into a text-file with the test-run and its exec-time. Spikes got removed to get useful results on the averages:
+----------------+-----------------------------+--------+--------+-----+
| benchname      | testname                    | max    | avg    | run |
+----------------+-----------------------------+--------+--------+-----+
| 127.0.0.1:3306 |   mysql_execute()           |  4.082 |  0.123 | 150 |
| 127.0.0.1:3306 |   mysql_real_query(large)   | 19.195 |   7.73 | 147 |
| 127.0.0.1:3306 |   mysql_real_query(small)   |  4.087 |    0.1 | 150 |
| 127.0.0.1:3306 |   mysql_stmt_bind_result()  |  0.002 |  0.001 | 150 |
| 127.0.0.1:3306 |   mysql_stmt_fetch()        |  0.003 |  0.001 | 150 |
| 127.0.0.1:3306 |   mysql_stmt_prepare()      |  0.176 |  0.128 |  30 |
| 127.0.0.1:3306 |   mysql_store_result(large) |   0.02 |   0.01 | 150 |
| 127.0.0.1:3306 |   mysql_store_result(small) |  0.003 |  0.001 | 150 |
| 127.0.0.1:3306 |  mysql_real_connect()       |  16.22 |  1.038 |  30 |
| 127.0.0.1:3306 |  test_prep_stmt()           |  4.638 |  0.936 |  30 |
| 127.0.0.1:3306 |  test_select()              |  4.461 |  0.622 |  30 |
| 127.0.0.1:3306 |  test_select_merlin()       | 53.883 | 38.561 |  27 |
| 127.0.0.1:3306 | benchmark done              | 56.824 | 41.361 |  27 |
| 127.0.0.1:4040 |   mysql_execute()           |  4.232 |   0.15 | 150 |
| 127.0.0.1:4040 |   mysql_real_query(large)   | 15.182 |  7.626 | 147 |
| 127.0.0.1:4040 |   mysql_real_query(small)   |  4.191 |  0.184 | 150 |
| 127.0.0.1:4040 |   mysql_stmt_bind_result()  |  0.002 |  0.001 | 150 |
| 127.0.0.1:4040 |   mysql_stmt_fetch()        |  0.003 |  0.001 | 150 |
| 127.0.0.1:4040 |   mysql_stmt_prepare()      |  0.275 |  0.185 |  30 |
| 127.0.0.1:4040 |   mysql_store_result(large) |  0.017 |   0.01 | 150 |
| 127.0.0.1:4040 |   mysql_store_result(small) |  0.003 |  0.001 | 150 |
| 127.0.0.1:4040 |  mysql_real_connect()       |  4.549 |  0.769 |  30 |
| 127.0.0.1:4040 |  test_prep_stmt()           |  5.053 |  1.131 |  30 |
| 127.0.0.1:4040 |  test_select()              |  4.769 |  1.042 |  30 |
| 127.0.0.1:4040 |  test_select_merlin()       | 57.647 | 39.239 |  29 |
| 127.0.0.1:4040 | benchmark done              | 59.558 | 42.265 |  29 |
+----------------+-----------------------------+--------+--------+-----+
If you compare the benchmark results:
test_prep_stmt()       0.936 vs.  1.131 ms (+ .2ms)
test_select()          0.622 vs.  1.042 ms (+ .4ms)
test_select_merlin()  38.561 vs. 39.239 ms (+ .7ms)
benchmark done:       41.361 vs. 42.265 ms (+ .9ms)
The was measured with all profiling options in the proxy disable. This is the setup you would use the load balancing, fail-over, ...
Delay Adaptive Balancing
partially implemented The state of the slaves is checked every few seconds to track the availability and the delay of the slaves. If the slave is unreachable or far behind it is taken out of the proxy-pool.
There are two ways to check the delay of the slave:
- check SHOW SLAVE STATUS for
Seconds_behind_master - send a ping into the replication tree
The ping is a UPDATE against a MEMORY table on the master and a SELECT on the slave to see if the ID is known:
master> CREATE TABLE ping ( id INT ) ENGINE=MEMORY;
master> UPDATE ping SET @id := id = id+1;
master> SELECT @id;
As we use connection-vars we can do this without running into a race-condition. On the slave we check for:
slave> SELECT id FROM ping WHERE id >= ?;
This is an simple check if the slave is up to date or not. If the update is executed it the end of each transaction we can track the progress of the replication based on the transaction level instead of byte-level (master_bin_log_pos) or time-level (seconds_behind_master).
Thanks to the statement injection we can inject this into the normal stream of operations transparent for the application. We try to keep it free of side-effects.
LUA
As a small side note: all the above features are implemented through a embedded lua engine.
Connection Pool
not implemented yet. Load Balancing isn't implemented yet, but will allow to all applications to utilize a connection pool which is maintained by the mysql-proxy. It will reduce the setup time for connections a bit.
The normal connection setup is:
- client connects to server
- server sends hand-shake
- client sends auth packet
- servers sends OK or ERR
with the connection pooling the connections between proxy and server are kept alive and are only reset when a client disconnects.
The proxy keeps a small pool of connections open and the initial hand-shake is answered without talking to the server. Depending on various factors we might be able to shadow the cost of a connection-setup.
Statement Load Balancing
Based on the connection pool we can use a single MySQL connection can multiplex multiple client connections against it. As long as the client is only using stateless SQL statements we can send the queries across any of the available connections we have active in the pool. This has the neat benefit that we can maintain a lot more connections to the client than we use to the server.
As soon as the client uses statements like:
SET @var = 1;SHOW SESSION STATUSFLUSH ...LOCK ...BEGINCREATE|DROP TEMPORARY TABLE ...
... and similar the connection gets a state and we can't use it for balancing any more. As automatic detection of such statements is tricky and will fail any we will add a command-line option we just gives the option to the user to allow multiplexing of client connections.
We will maintain transactions and LOCKs, but all other statements should just not be used in multiplexing mode.
XA Transaction Manager
not implemented yet The proxy could change transactions in the way they commit against a server. For HA reasons you might set up two masters which both get the same statements at the same time without using the mysql internal replication.
By replacing the BEGIN with a XA START "trx_name" and the COMMIT by a XA END ..., XA PREPARE .. and XA COMMIT we can use the two-phase commit support by innodb to commit a transaction against two or more databases.
This is giving the application synchronous replication for free.
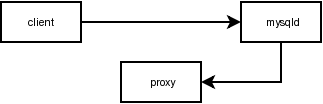
Change Management
The proxy can also operate in a reverse mode where it receives the statement as a replication client. It allows the proxy to track all statements which cause a change to the DB objects in the server.
For now it is filtering:
- CREATE|ALTER|DROP TABLE
- CREATE|DROP INDEX
- CREATE|ALTER|DROP DATABASE
including time-stamp and user-name (if available). Base on this information you can track changes on your DB-objects, versionize the schema automaticly and build a DDL-diff.
$ mysql-proxy --repclient-port=3306
For now you need a account:
CREATE USER repl@127.0.0.1;
GRANT SUPER ON *.* TO repl@127.0.0.1;
Username repl, No password. The password-scramling isn't implemented yet.
$ ./agent/src/network-mysqld --mode=reverse
reading binlog from: binlog-file: hostname-bin.000009, binlog-pos: 366
(DDL) thread-id = 2, exec_time = 0, error-code = 0000
  QUERY: drop table t1
(DDL) thread-id = 2, exec_time = 0, error-code = 0000
  QUERY: create table t1 ( id int not null )
(DDL) thread-id = 2, exec_time = 0, error-code = 0000
  QUERY: alter table t1 add primary key (id)
Replication Off-Loading
not implemented yet. Similar to a MySQL server with blackhole is default storage engine a proxy can forward the binlog to multiple mysqld-slave with a lot less load than a full mysql-server.
Comments